Simply click on the Map for the Report:

Result for 2020 - Q1:

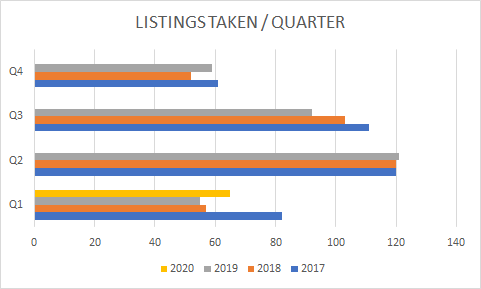
This in the number of new listing taken each quarter. It does not include the existing inventory that is on the market which means the number of homes on the market could be more.

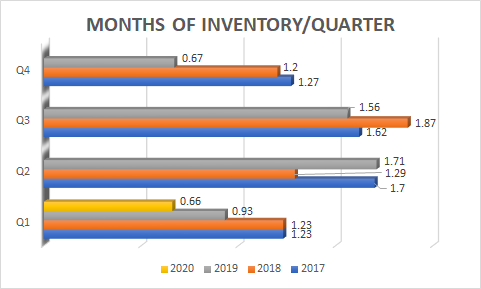
Months of inventory is the measure of how many months it would take for the current inventory of homes on the market to sell, given the current pace of home sales.
Months of supply is a good indicator of whether a particular real estate market is favoring buyers or sellers. Typically, a market that favors sellers has less than 6 months of supply, while more than 6 months of supply indicates an excess of homes for sale that favors buyers.
The months of inventory in the City of Beverly is very low. Since January of 2017, the City of Beverly has not been higher than 2 months. With inventories being so low and the pent up demand for housing it has been a seller's market for a long time. It will be interesting to see what transpires over the next few months!

The chart above when looking at it at face value doesn't show what it should be showing--Are home values going up? The way I look at this chart to determine if values are rising is to take an average of the median prices because the is a huge disparity for home prices within the City of Beverly and then getting the average of each quarter which evens out the number better to see if prices are on the rise. This is what I now see - the average of the median sales price per quarter:
2017 - $457,000
2018 - $466,000
2019 - $505,000
I hope this helps you to understand the Beverly
Real Estate Market
Please Stay Safe & Healthy!
